
Severe storms knocked out power for 375,000 Indiana residents on August 11, 2026, according to the Northern Indiana Public Service Company (NIPSCO). As power was restored over the following days and weeks, residents of the majority-Black city of Gary, Indiana, experienced some of the longest outages. A class action lawsuit against NIPSCO and the Governor’s calls for an investigation have put the spotlight on Gary, utilities, and inequity.
Social Explorer can support research into Gary and other communities affected by power outages. Demographic and environmental data provide additional insight and can inform future disaster response and planning efforts.
According to the 2024 American Community Survey five-year estimates, Gary is home to 68,113 residents. Racially and ethnically, Gary is 75.7% Black, 9.4% White non-Hispanic, and 10.4% Hispanic, reflecting a composition distinct from both Indiana and the U.S. The following chart, created using Social Explorer, compares Gary’s diversity with the state and the nation.
%20Gary%20Indiana.jpg)
In Gary, the median household income is $38,731, less than half of the national median income of $80,734. Nearly one in three Gary residents live below poverty (33.1%), far higher than the rest of Indiana (12.3%) and the U.S. (12.5%).
Utility Costs and Environmental Justice
Utility costs add to the economic burdens in the city, as an analysis of ACS data shows. Most households in Gary (92.6%) and Indiana (95.9%) pay for electricity separately from other utilities. The following chart shows the distribution of monthly costs for households in the city and the state.
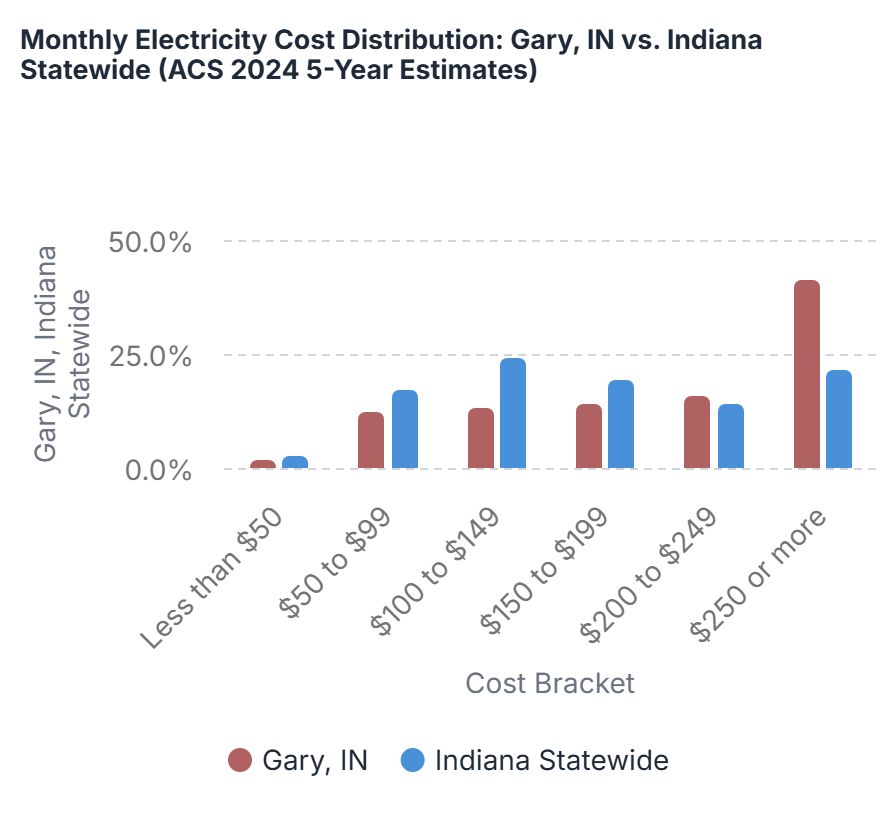
Gary’s electricity costs are concentrated in the higher brackets: Among households that pay for electricity separately, 41.6% pay $250 or more per month, compared with 21.7% statewide. Gary’s share in the highest bracket is nearly twice the statewide share. Gary’s distribution is weighted much more heavily toward higher electricity costs, while Indiana’s statewide distribution is concentrated in the $100–$199 range.
Gary has a much smaller share of households that pay for gas separately—31.8%, compared with 59.6% statewide. Among households that do pay separately, 44.6% in Gary pay $150 or more per month, compared with 22.4% statewide—nearly twice the statewide share.
The American Community Survey also documents the age of housing stock. The median structure in Gary was built in 1957, meaning half of all housing units predate that year. Gary's housing stock is 21 years older than Indiana as a whole (median age of structure 1976), and more than two decades older than the national median of 1980. Gary households that pay utilities separately consistently face higher costs than the Indiana average. This is consistent with Gary's older housing stock, infrastructure challenges, and lower-income demographics that can make energy efficiency improvements harder to access.
Gary’s economic disadvantages, compounded by high utility costs and an aging housing stock, potentially make residents more vulnerable to disasters.
Social Explorer’s updated Environmental Justice Screening Tool (EJScreen) highlights Gary’s particular vulnerabilities. Built using the same methodology as the EPA’s discontinued EJ Screen tool, Social Explorer’s EJScreen enables researchers to examine these conditions in greater depth.
The following side-by-side map shows the Black population of Gary as well as the EJ Screen index for Toxic Air. Zoom in to see the details and concentrations.
According to EJScreen, Gary ranks substantially higher than national medians across most environmental burden indexes, with several indicators in the 99th national percentile: nitrogen dioxide (99.7th percentile), toxic releases to air (99.9th percentile), traffic proximity and volume (99.5th percentile), and Superfund proximity (99.7th percentile). Gary's demographic profile also shows elevated vulnerability markers: 58% low-income residents (89.5th percentile), 90.6% people of color (95.3th percentile), and 26.4% with below-average life expectancy (98.2th percentile). The demographic index for Gary (2.87, 96.4th percentile) substantially exceeds the national average (1.37), indicating cumulative socioeconomic disadvantage.
Another majority-Black city, Memphis, TN, also recently experienced severe thunderstorm damage and power outages. Again, a mostly-Black city endured longer outages. As reporter Adam Mahoney wrote in Capital B News, "When the power goes out in America, it does not go out equally." Social Explorer’s EJScreen data confirms that Memphis City shows similarly elevated environmental and demographic burdens, though generally one to three percentile points lower than Gary across most measures.
More Community Impact Analysis with Social Explorer
Demographic information and local context can help the public, advocates, and policymakers monitor the effects of power outages, identify gaps in response efforts, and press for action. Learn more about Gary, Memphis, and communities across the country using Social Explorer’s data and tools.
New to Social Explorer? Sign up for a free Social Explorer account to try it out today.