
To mark this month’s National Association of Counties (NACo) annual conference, Social Explorer is focusing on the event’s host city, New Orleans, and the Ernest N. Morial Convention Center. First built for the 1984 World’s Fair, the convention center began hosting events in 1985 and has grown to become one of the largest convention centers in the nation.
According to the most recent American Community Survey data (five-year 2024), the convention center census tract is a relatively small, highly educated community with a population of 2,137. Nearly three-quarters of adults age 25 and over hold at least a bachelor's degree (73.4%) — a very high rate by any standard. The median household income of $103,750 is well above the New Orleans city median of $56,631. The tract is majority White (72.6%), minority Black (11.3%), and has a notable share of residents identifying as two or more races (10.8%). Renters make up about three-quarters of occupied housing units, which is common in urban New Orleans neighborhoods. The poverty rate of 8.6% is relatively low compared to the city as a whole (22.6%).
What was the neighborhood like before the convention center was built? Looking back to the 1980 Census (also available in Social Explorer’s data library), we can profile the neighborhood and examine changes around the convention center site from before and after its construction.
From 1980 to the present, the convention center tract population grew by 860 residents (+67%), bucking the citywide trend of population loss. During the same period, New Orleans lost roughly 186,000 residents (-33%). Hurricane Katrina (2005) was the single largest driver, but the city had been losing population since the 1960s due to suburbanization and economic decline.
%20Population_%201950%E2%80%932024.jpg)
Racial composition flipped completely in the convention area. In 1980, Tract 77 was 82% Black and only 17.5% White. By 2024, it became 72.6% White and 11.3% Black–a near-reversal. Zoom in on the side-by-side population density maps from 1980 and from the most recent ACS to see how the convention center and surrounding neighborhoods changed.
For a more detailed economic and employment analysis, we turn to the US Census Bureau’s County Business Patterns data. Available in Social Explorer from 2010 to 2023 (with 2024 data coming soon), this dataset provides annual business statistics by industry with establishment, payroll and employment wage details.
The following chart shows the breakdown of business types:
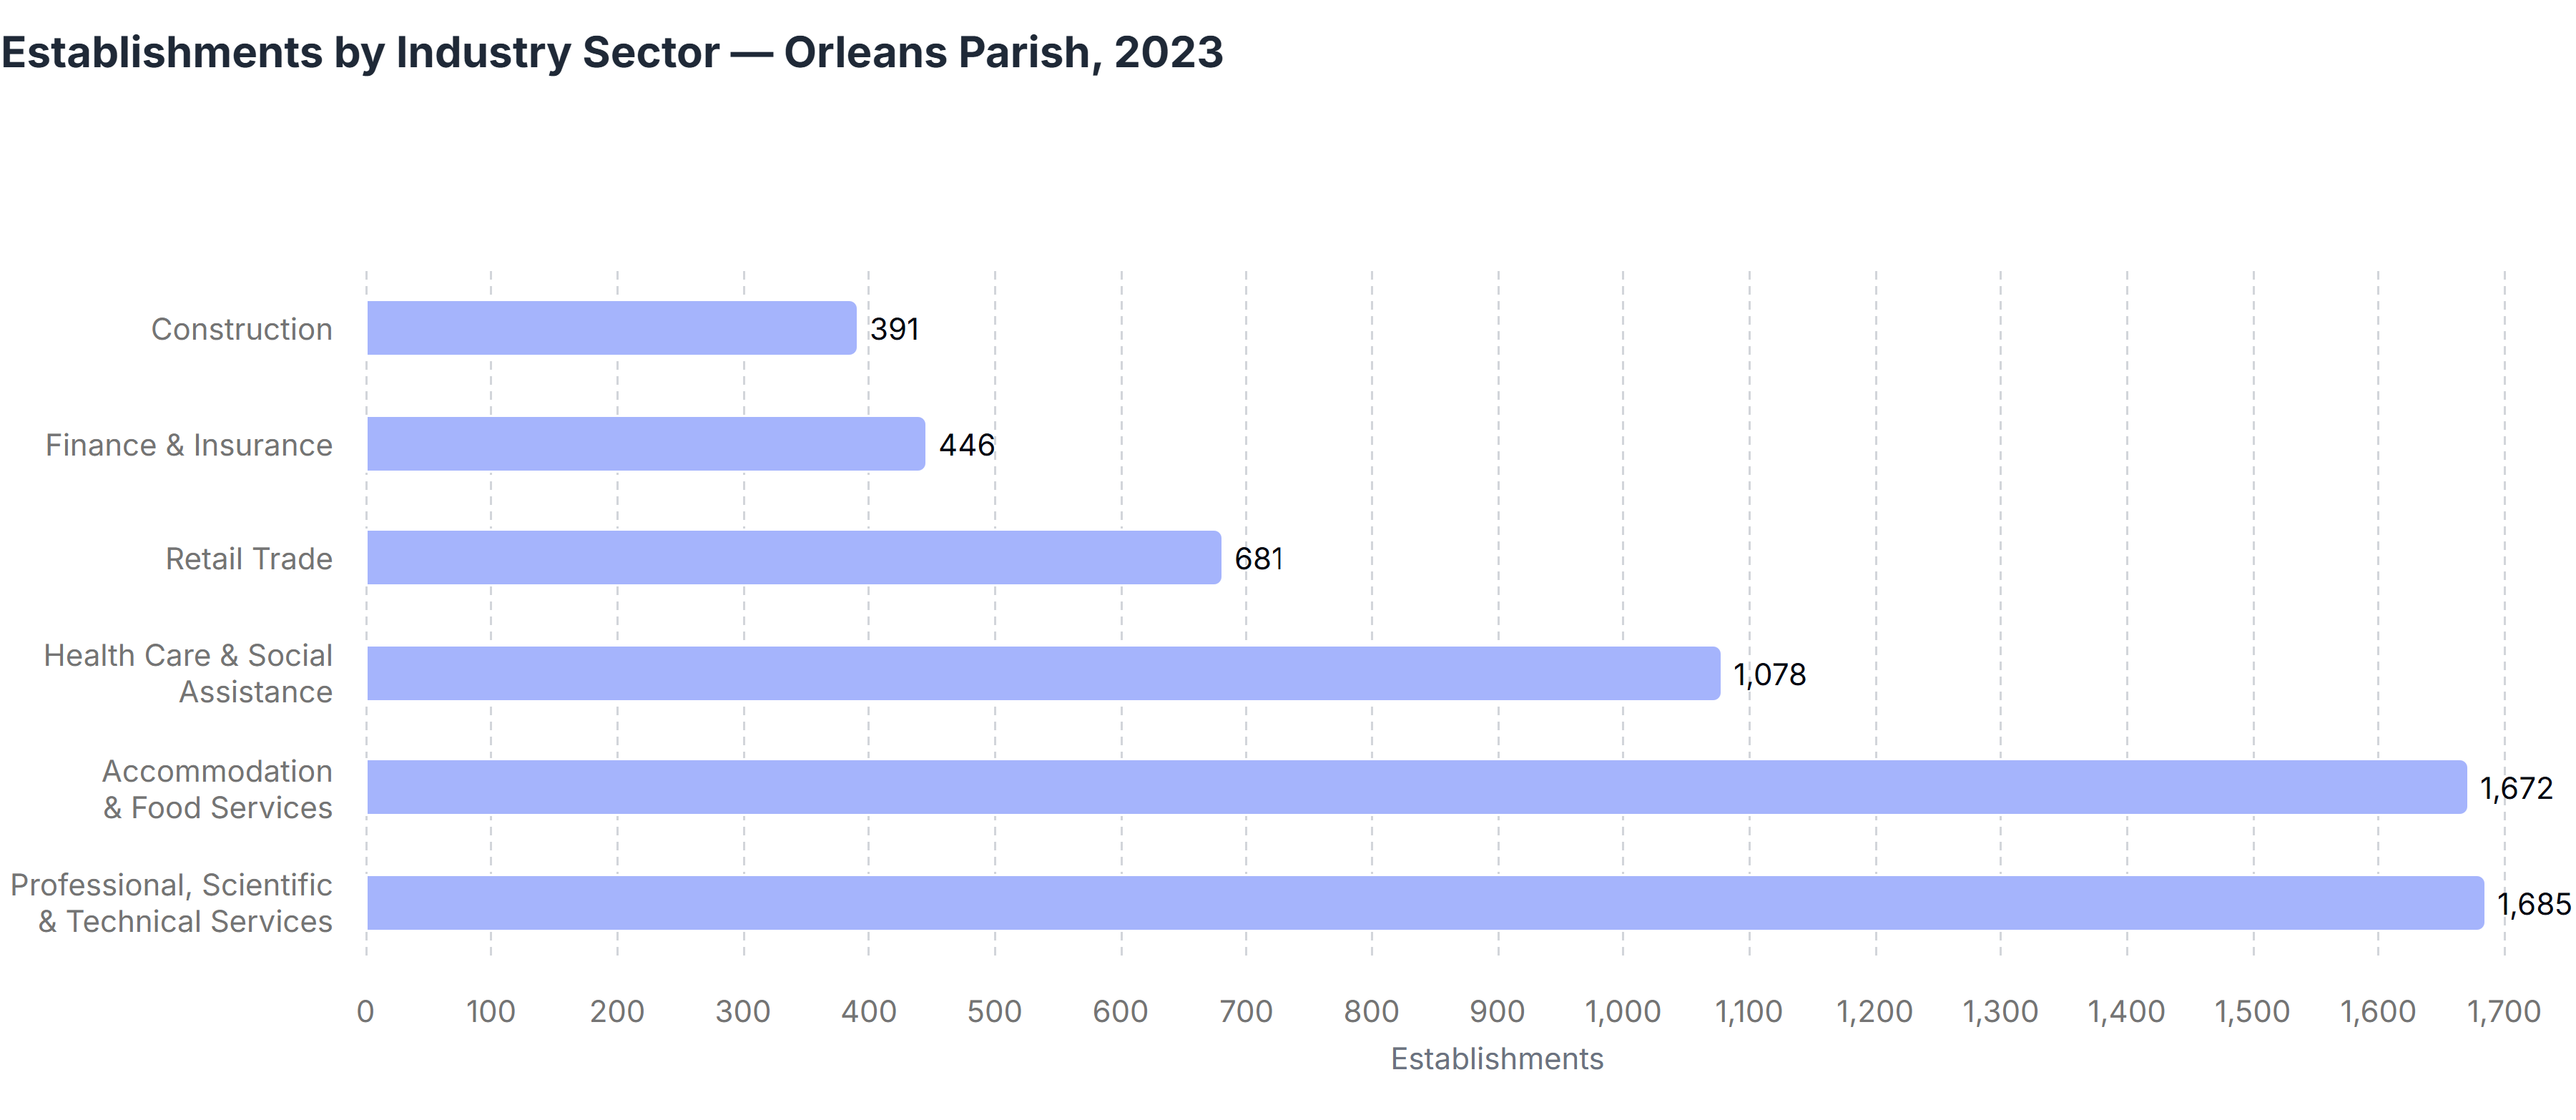
New Orleans Parish had 10,027 total business establishments in 2023, generating a combined annual payroll of approximately $10.4 billion. The 2023 County Business Patterns data also shows that New Orleans Parish has 168 Accommodation sector establishments (hotels, motels and other lodging, which doesn’t include certain types of accommodation like short-term-rentals). These employed 10,121 employees with a total annual payroll of $446,790,000. These kinds of numbers could add insights as a new hotel proposal is being debated. The 27-story Omni hotel with more than 1,000 rooms could bring new business and jobs to the area, but would it be enough to offset the tax incentives the project could receive?
The Department of Labor’s Local Area Unemployment Statistics (LAUS) are also available in Social Explorer. Spanning from 1976 to 2026, these data offer historical and current insight into employment. Looking at New Orleans from 1990 to the present, the parish experienced multiple waves of employment trends. From 1990 to 2005, the labor force held relatively steady between roughly 193,000 and 209,000, peaking at 208,820 in 2000. After the devastation of Hurricane Katrina in 2005, the labor force dropped to 107,173 in 2006, representing a loss of nearly 86,000 workers in a single year as mass displacement emptied the city.
In the following years, employment then climbed steadily back up to around 182,000–184,000 by the late 2010s, but never fully recovered to pre-storm levels. New Orleans, like so many communities, then experienced a modest dip in employment during the pandemic years, followed by a slight decline to around 175,000 by 2023 to 2024, suggesting the parish's working-age population has continued to shrink gradually. (Annual LAUS data is available from 1976 to 2024, and then monthly numbers for 2025 to the present, with annualized estimates computed and available once released to account for seasonal swings.)
Learn more about the flows of New Orleanians and commuters from the Urban Mobility Report. This annual study produced by the Texas A&M Transportation Institute quantifies traffic congestion trends across major U.S. urban areas, measuring key indicators such as travel delay, excess fuel consumption, congestion cost, and the Travel Time Index for commuters. Social Explorer has the Urban Mobility report from 1982 to 2024 for hundreds of urban areas around the nation.
New Orleans ranks number 22 on the Travel Time Index (1.29), meaning peak-hour trips take 29% longer than they would in free-flow conditions. That places it among the top 5% most congested urban areas nationally, which is notable for a metro of its size. The Freeway Planning Time Index of 1.95 (ranked #16 nationally) means that to reliably arrive on time, a New Orleans commuter must budget nearly twice the free-flow travel time. The average New Orleans auto commuter loses 68 hours annually to congestion per year. In 2024, New Orleans congestion cost $1.66 billion in wasted time and excess fuel burned due to congestion across the urban area. Dig into the Urban Mobility Report and more transportation-related data and analyses with Social Explorer’s library of data and mapping resources.
This sampling of Social Explorer insights into New Orleans offers just a taste of what’s available. Consult the Data Library for datasets on an array of topics, including crime data, environmental justice data, transportation data, and more. And if you happen to be at the NACo conference, please visit our booth in the exhibition hall!
Explore and Analyze More New Orleans Insights with Social Explorer:
Check out Social Explorer’s vast data library for more datasets and opportunities to learn about New Orleans and communities around the country. Whether you’re just visiting a location or you’re working on in-depth planning analyses, Social Explorer data and tools can help you gain community insights in just a few clicks.
Subscribers can get started or sign up for a free Social Explorer account to try it out today.